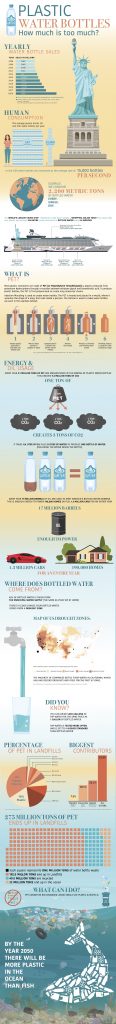
Infographic: Plastic Water Bottles
posted in Graphic Design, Information Design by admin on June 6, 2020Honestly, I was dumbstruck when I started doing research on Water Bottles so that I could design this infographic. I hope that this information spreads a little light on how much plastic waste humans create on a daily basis. It’s a global problem and something that, after extensive research, I am very passionate about increasing awareness of this problem.
A look at the entire infographic can be seen at the bottom of this post. But for now, I’ll take you through each section beginning at the top.
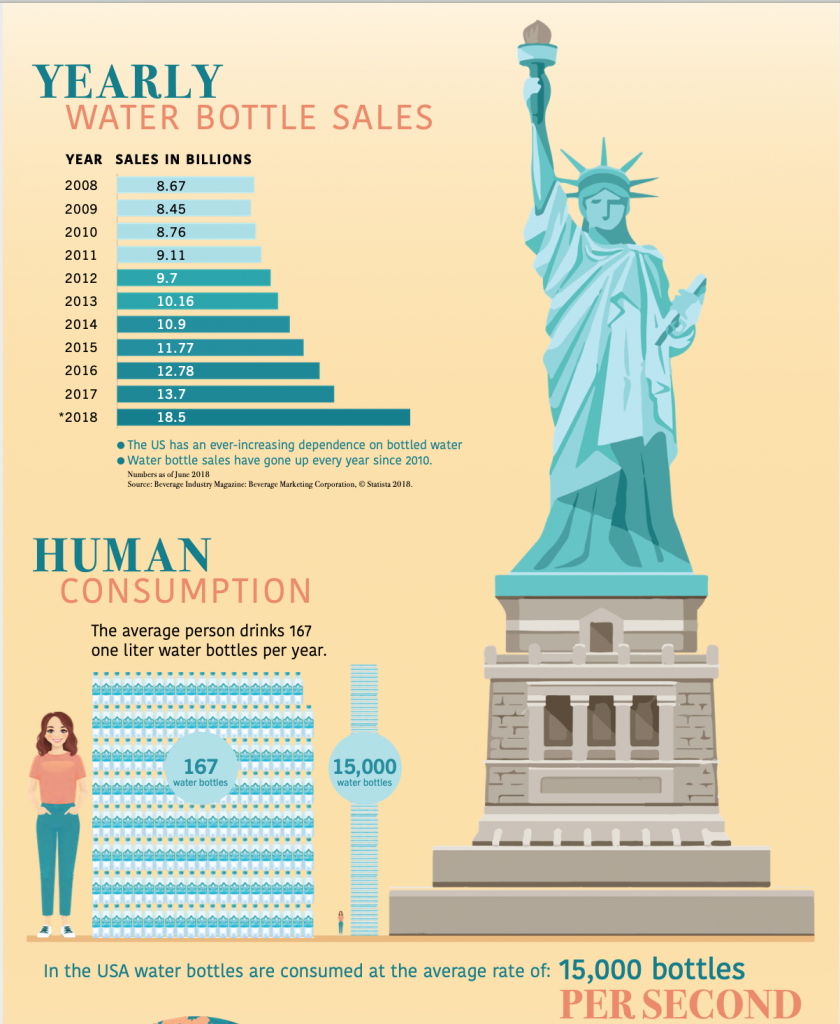
This really is the big question: How much is too much?
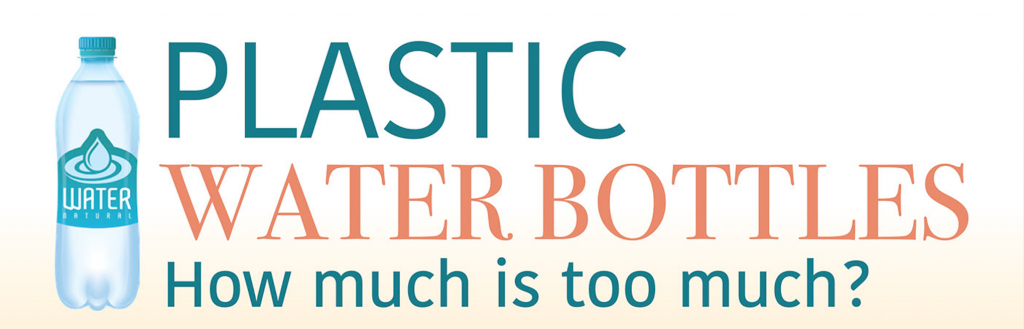
Based on studies from the Beverage Marketing Corporation in 2018 (over 2 years ago) water bottle sales just keep increasing.
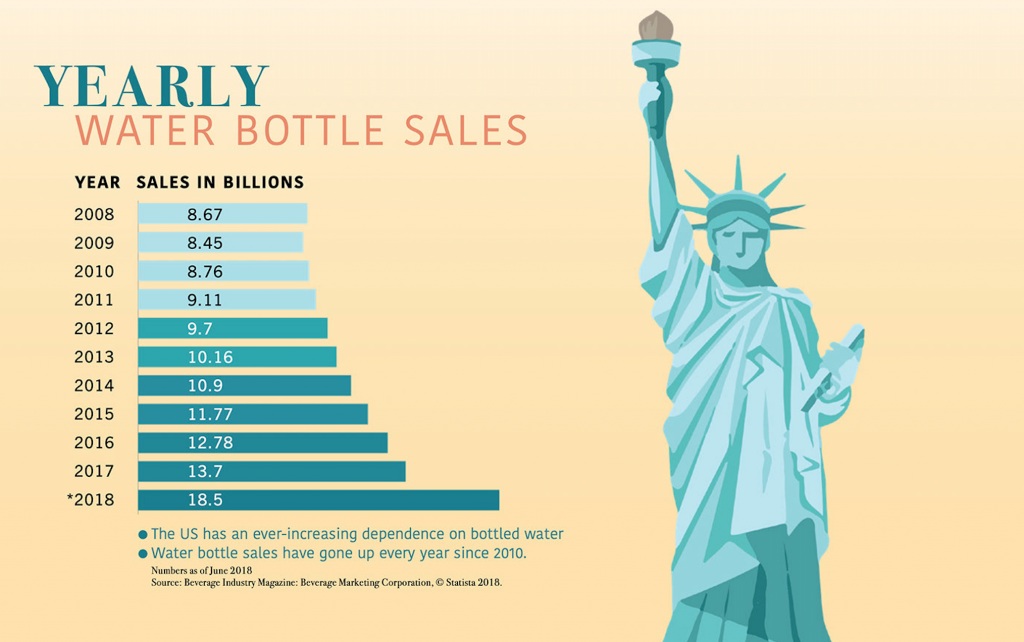
A look at the average human water bottle consumption for one year:
In the United States alone, we consume 15,000 water bottles PER SECOND! Focus on that tiny human next to the Statue of Liberty. The water bottles stacked up next to her, this is what 15,000 water bottles look like.
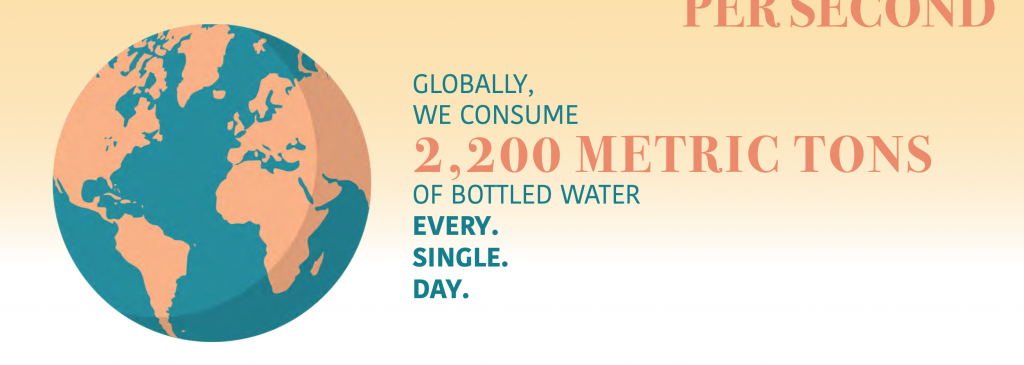
And it’s not just the USA. This is a global problem. As a planet, we consume 2,200 metric tons of bottled water every day.
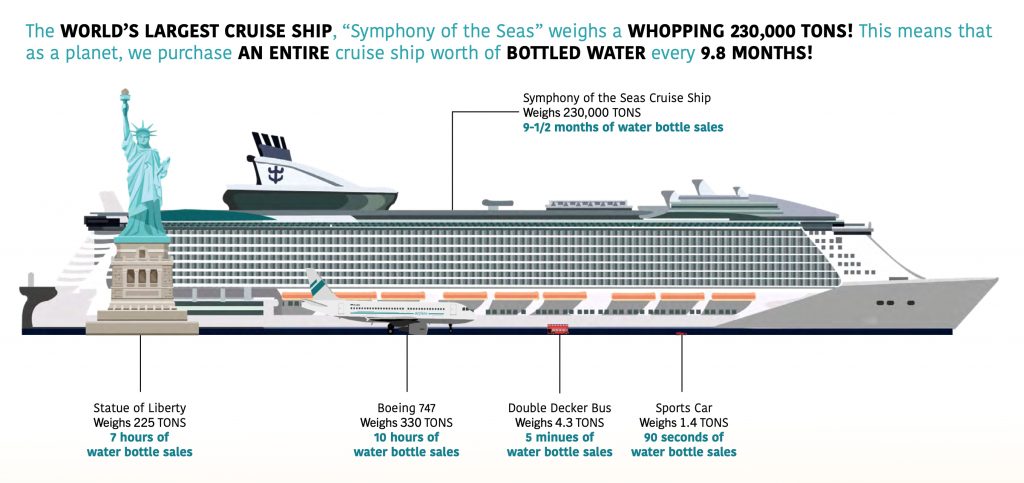
As a planet, in weight comparison, we consume a Statue of Liberty worth of water bottles every 7 hours, a Boeing 747 every 10 hours, a double-decker bus every 5 minutes, and a sports car every 90 seconds. SECONDS!! How are we not drowning in plastic? Oh, wait. We sort of are.
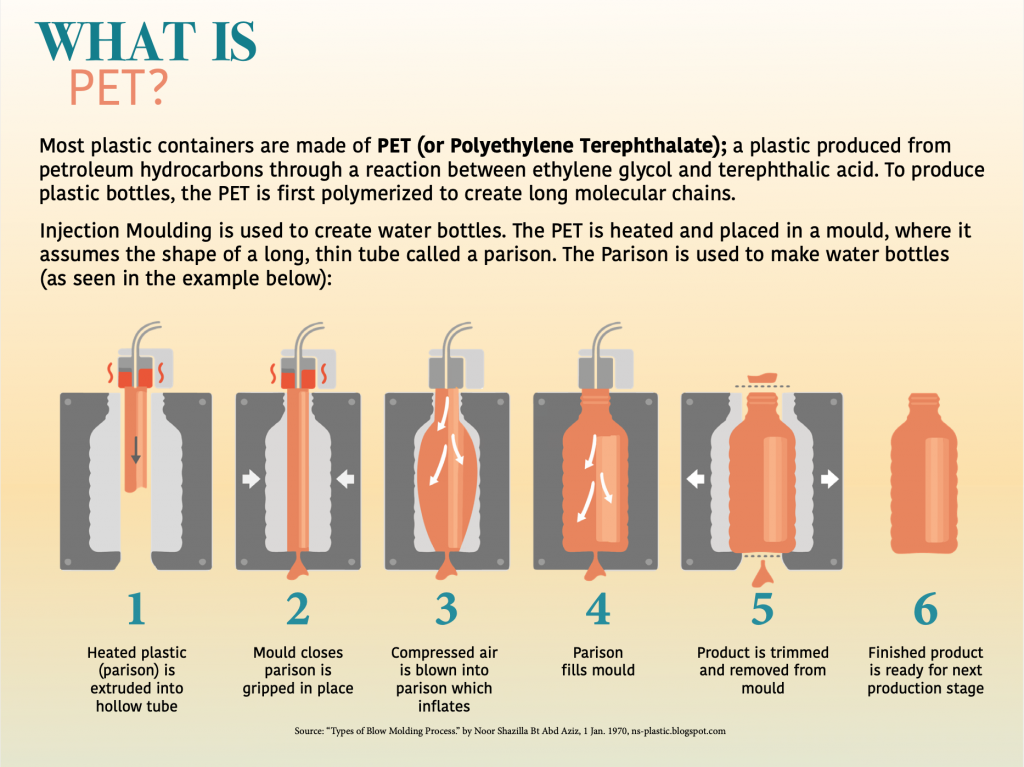
What exactly is plastic anyway? And how are water bottles made? How much energy does it take to make these water bottles in the first place?
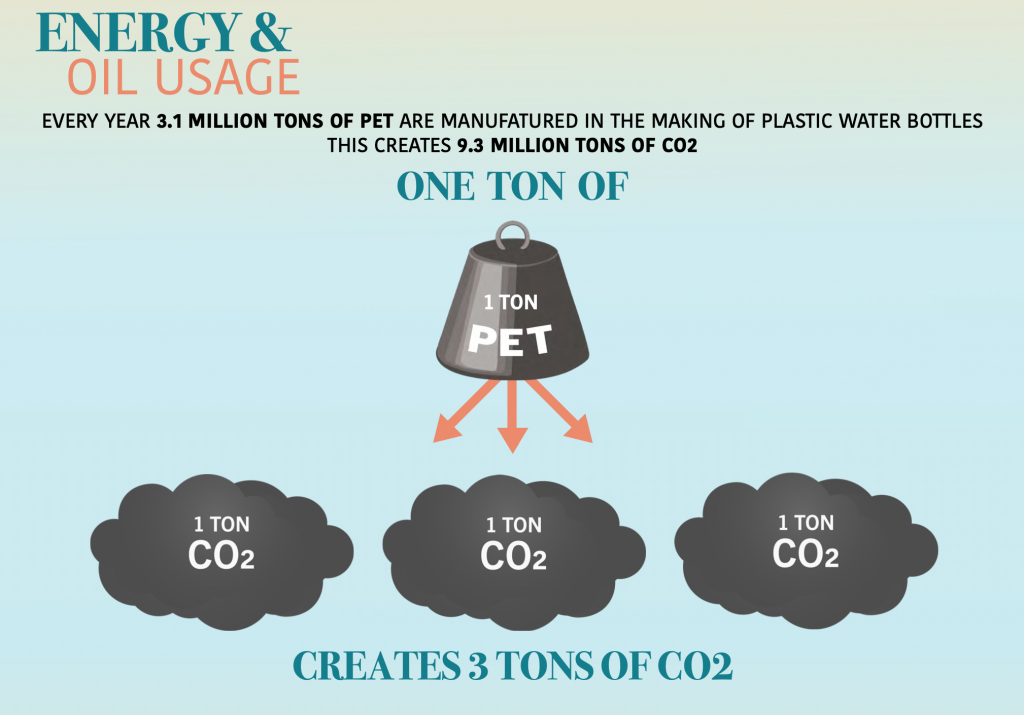
Manufacturing plastic takes a lot of resources as well as creating waste in the form of CO2. For every ONE ton of PET that is manufactured, THREE tons of CO2 is released into the Earth’s atmosphere.
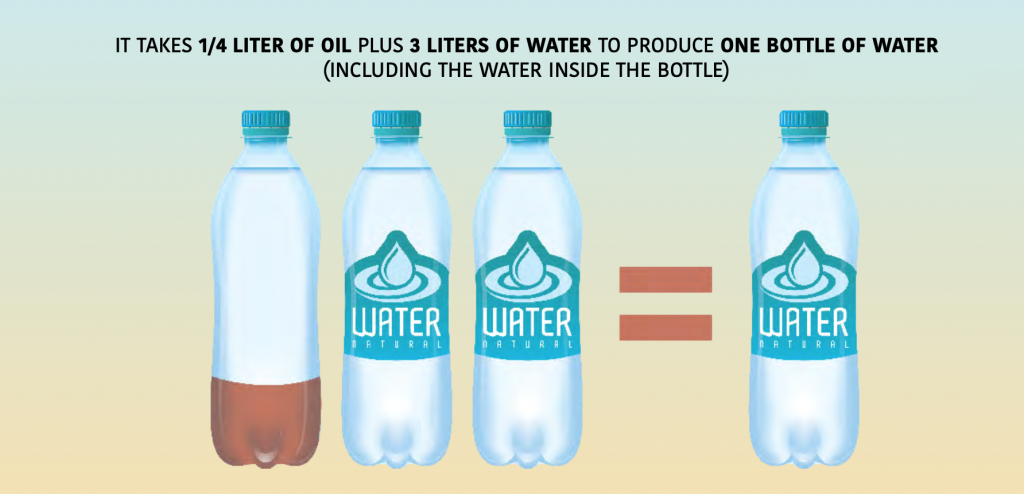
Then there is oil usage. It’s crazy to think that it takes oil and water to make bottled water. It takes more water than is actually bottled inside the plastic. 2 liters of water and 1/4 liter of oil are used to make just one bottle. ONE bottle.
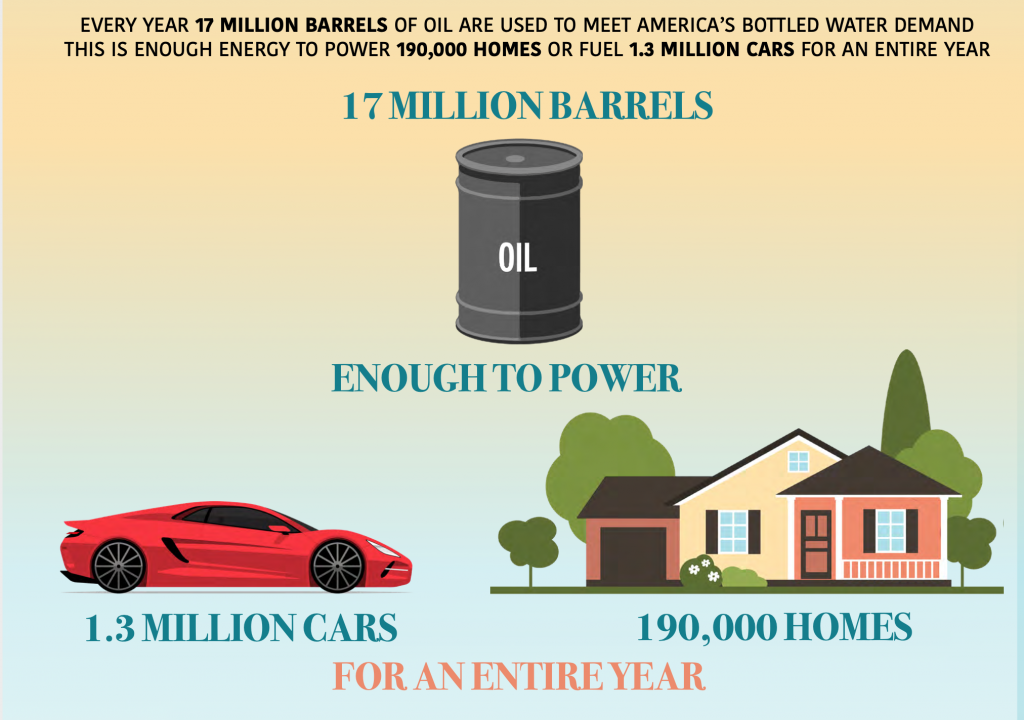
Let’s talk about the oil. That 1/4 liter of oil per bottle, translates into 17 million barrels of oil every year.
This is enough oil to power 190,000 homes for an entire year!
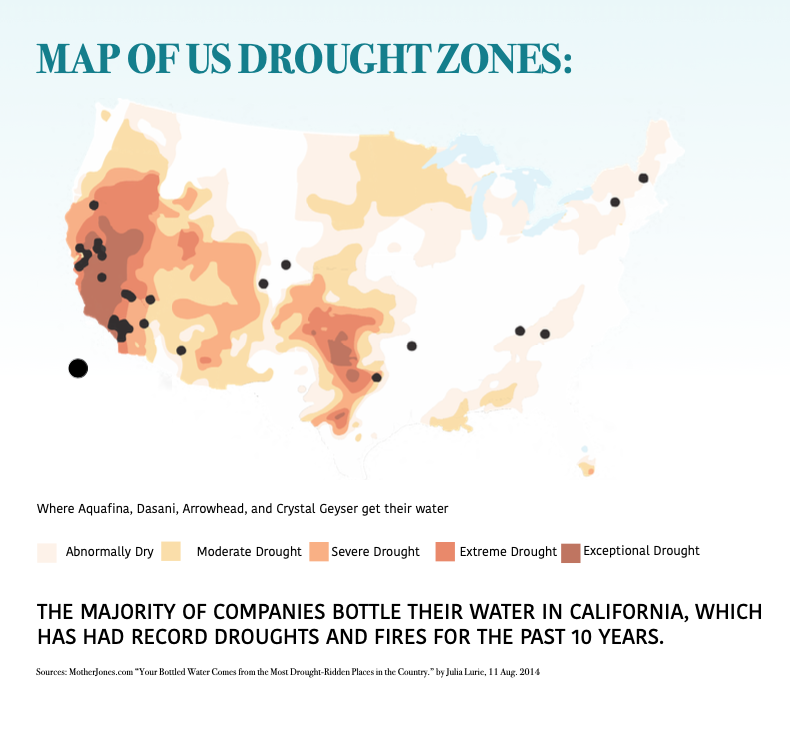
Then there’s the water itself. Where does all this water come from? Well, it’s not a happy answer.
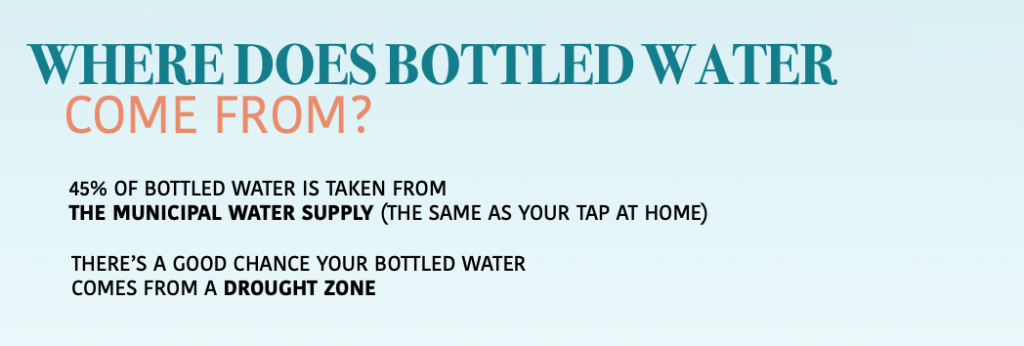
Most of the water comes from California, a state that desperately needs its water. Because of drought and fires in California entire cities have burned to the ground and thousands of people lose their homes and businesses.
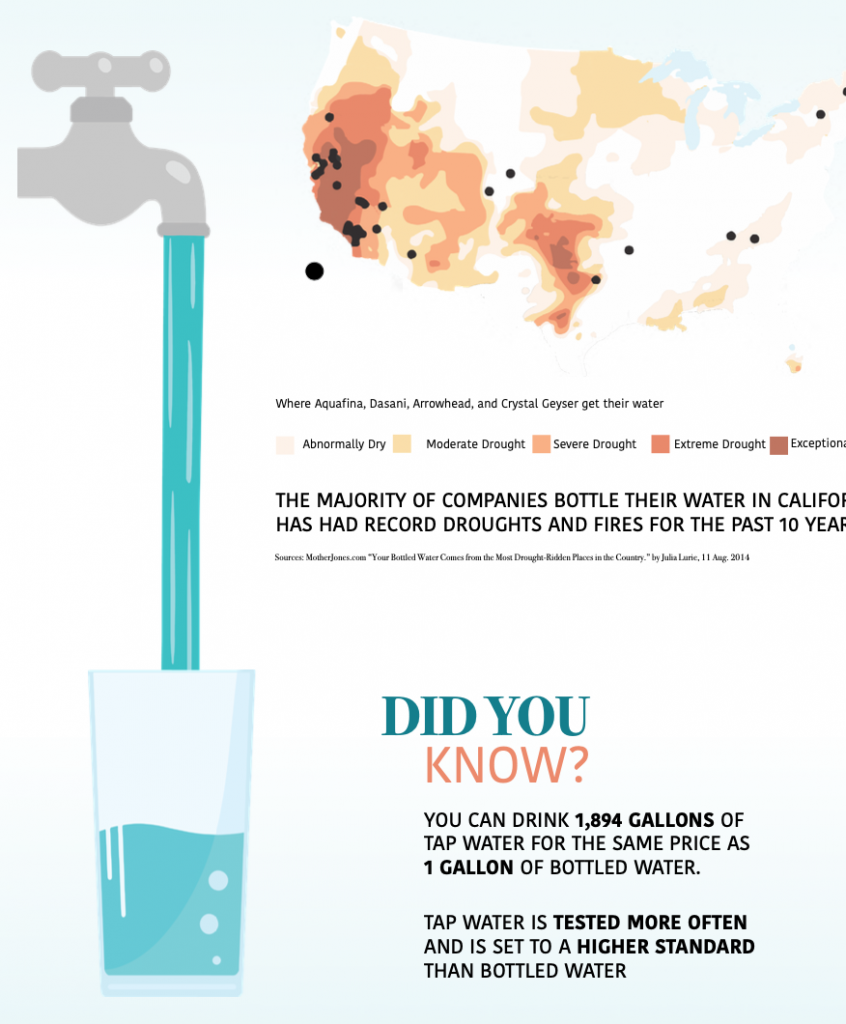
Is bottled water really safer than tap water? Tap water is actually much safer than bottled water and is WAY cheaper. You can drink almost 2,000 gallons of tap water for the price of one gallon of bottled water. Yup. Is your mind blown yet?
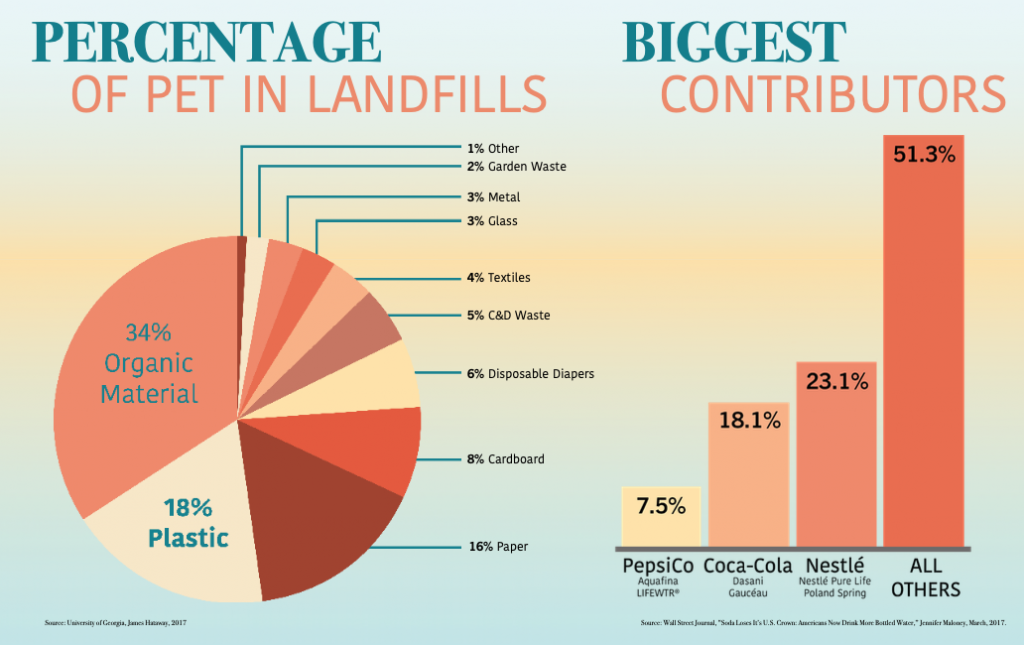
Where does all the plastic go when the bottle is empty?
We’re living on top of so much plastic.
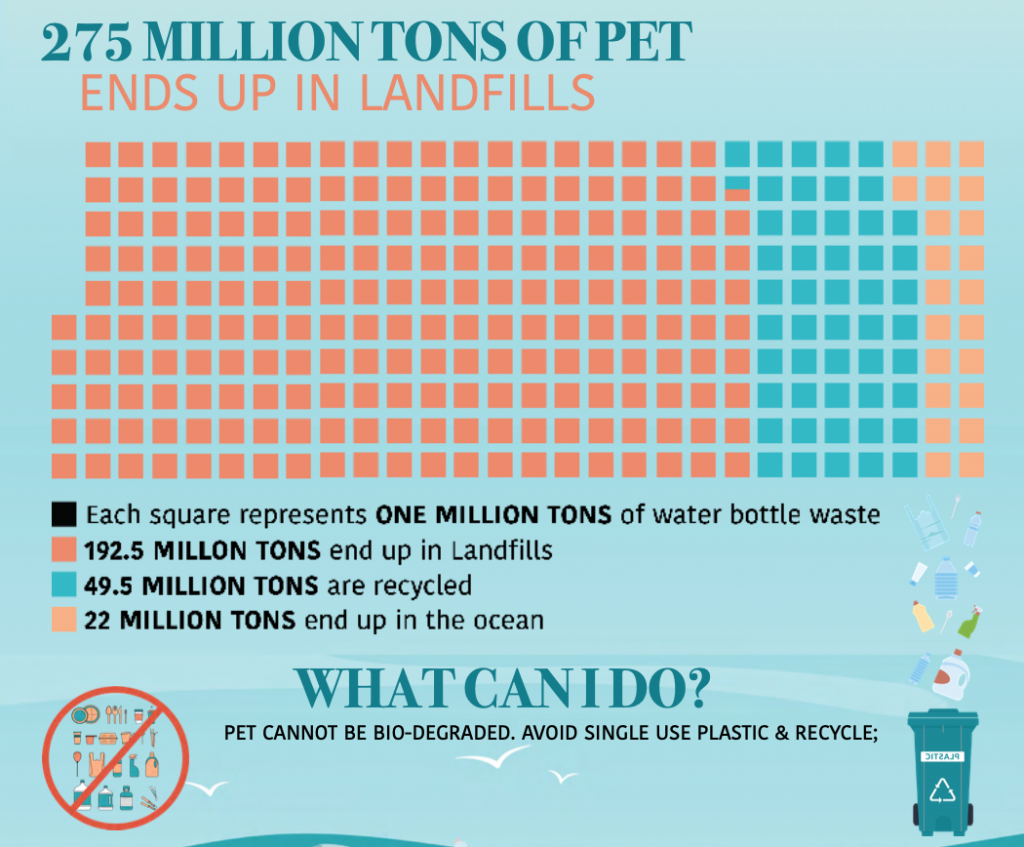
It’s scary to live in a world of plastic now. I can’t imagine was it will be like in 2050!
Please be aware that PET does not biodegrade. Please avoid single-use plastic items such as plastic cups and utensils, plastic bags at the grocery store, plastic laundry soap containers, or milk cartons. Please Recycle the plastics that you do use.
I hope this infographic helps you see how much plastic waste is consumed globally. Start to notice all the plastic around you and build your awareness. I urge you to do what you can to reduce your own plastic usage.
Entire infographic in one image: